実践ML評価: 精度、再現率、AUCで正確性を超える

Table of Contents
クレジットカード詐欺を予測する機械学習モデルが99.9%の精度を報告しました。経営陣は大喜びしましたが、取引の0.1%が不正であり、モデルがすべてのリクエストに対して単にis_fraud = Falseと予測していたことを知って愕然とします。ほぼ完璧な精度を誇りながら、詐欺を0%しか検出していなかったのです。
これが精度パラドックスです。現実世界の機械学習では、データセットが不均衡で、偽陽性(false positive)のコストが偽陰性(false negative)のコストと大きく異なる場合、生の精度は無意味です。
このガイドでは、分類モデルを評価し、ビジネス上の問題に適した指標を選択し、Pythonで決定閾値(decision threshold)を調整するための、本番環境レベルのフレームワークを提供します。
1. 混同行列(Confusion Matrix)と主要な評価指標
                     ┌─────────────────────────────────────────┐
                     │            Actual Reality               │
                     │    Positive (1)   │    Negative (0)     │
┌─────────┬──────────┼───────────────────┼─────────────────────┤
│ Model   │ Pos (1)  │ True Pos (TP)     │ False Pos (FP)      │
│ Predict ├──────────┼───────────────────┼─────────────────────┤
│         │ Neg (0)  │ False Neg (FN)    │ True Neg (TN)       │
└─────────┴──────────┴───────────────────┴─────────────────────┘
これら4つの値から、すべての主要な評価指標が導き出されます。
\text{Precision} = \frac{\text{TP}}{\text{TP} + \text{FP}} \quad \text{(モデルが陽性と予測したとき、それが正しい頻度は?)}
\text{Recall (Sensitivity)} = \frac{\text{TP}}{\text{TP} + \text{FN}} \quad \text{(すべての真の陽性のうち、どれだけを検出できたか?)}
\text{Specificity} = \frac{\text{TN}}{\text{TN} + \text{FP}} \quad \text{(すべての真の陰性のうち、どれだけを正しく陰性と判断できたか?)}
2. PrecisionとRecallの選択
すべての分類モデルは、連続的な確率 p \in [0, 1] を出力します。決定閾値(例えば0.5から0.2へ)をシフトすると、Precisionを犠牲にしてRecallが向上します。
Low Threshold (e.g. 0.1) ───────────► High Recall, Low Precision (Catches everything, high noise)
High Threshold (e.g. 0.8) ──────────► High Precision, Low Recall (Only fires on sure things)
Recallを優先する場合(偽陰性(False Negatives)を最小化):
- 詐欺検出: 5,000ドルの不正送金を見逃すこと(FN)は、正規の顧客にSMS認証を時々トリガーすること(FP)よりもはるかに悪い結果を招きます。
- 病気/がん検診: 見逃された腫瘍は致命的です。偽陽性は無害な追加生検につながります。
- セキュリティ脅威検出: アクティブな侵入を見逃すことは壊滅的です。
Precisionを優先する場合(偽陽性(False Positives)を最小化):
- スパムフィルター: 住宅ローンの承認メールがスパムフォルダに送られるよりも、受信トレイに1通のスパムメールがある方がましです。
- 自動アカウント停止: 無実の有料顧客を停止することは、顧客離れと評判の低下を引き起こします。
- コンテンツレコメンデーション: 無関係な動画を表示すると、ユーザーはプラットフォームを離れてしまいます。
3. 指標の組み合わせ: F_1 vs F_\beta Score
標準的なF_1スコアは、PrecisionとRecallの調和平均であり、両方を均等にバランスさせます。
F_1 = 2 \cdot \frac{\text{Precision} \cdot \text{Recall}}{\text{Precision} + \text{Recall}}
ビジネスでどちらか一方を優先する場合は、F_\betaスコアを使用します。
F_\beta = (1 + \beta^2) \cdot \frac{\text{Precision} \cdot \text{Recall}}{(\beta^2 \cdot \text{Precision}) + \text{Recall}}
- \beta = 2.0 (F_2スコア): RecallをPrecisionの2倍重視します(詐欺/医療診断に最適)。
- \beta = 0.5 (F_{0.5}スコア): PrecisionをRecallの2倍重視します(検索&スパムフィルタリングに最適)。
4. ROC-AUC vs Precision-Recall AUC (PR-AUC)
どちらの指標も、すべての可能な決定閾値(0.0から1.0まで)でモデルを評価しますが、不均衡なデータではその振る舞いが大きく異なります。
ROC Curve:   Plot of True Positive Rate (Recall) vs False Positive Rate (FPR)
PR Curve:    Plot of Precision vs Recall
from sklearn.metrics import roc_auc_score, average_precision_score

# ROC-AUC is misleadingly high on imbalanced datasets!
roc = roc_auc_score(y_true, y_pred_prob)          # e.g., 0.985 (looks amazing)

# PR-AUC (Average Precision) reflects real-world rare class performance
pr_auc = average_precision_score(y_true, y_pred_prob) # e.g., 0.620 (reveals true difficulty)
経験則:
- クラスがほぼ均衡している場合(40/60から50/50)、ROC-AUCを使用します。
- 陽性クラスが稀な場合(データセットの5%未満)、**PR-AUC(Precision-Recall AUC)**のみが信頼できる指標です。ROC-AUCは、真陰性(True Negatives)の膨大な数によって過大評価されます。
5. 確率キャリブレーション: 数値を信頼できるか?
多くの最新の分類器(特にXGBoost、LightGBM、ディープニューラルネットワーク)は、キャリブレーションされていない確率を出力します。モデルが100人のユーザーに0.80の確率を割り当てた場合、そのうち正確に80人が陽性であるべきです。もし40人しか陽性でなければ、モデルは過信していることになります。
キャリブレーションの測定と修正
from sklearn.calibration import CalibratedClassifierCV, calibration_curve
from sklearn.metrics import brier_score_loss
import lightgbm as lgb

# Train raw classifier
base_model = lgb.LGBMClassifier()
base_model.fit(X_train, y_train)

# Calculate Brier Score (lower is better; 0 = perfect calibration)
raw_brier = brier_score_loss(y_test, base_model.predict_proba(X_test)[:, 1])

# Calibrate using Isotonic Regression or Platt Scaling (Sigmoid)
calibrated_model = CalibratedClassifierCV(
    estimator=base_model,
    method='isotonic', # or 'sigmoid' for smaller datasets (< 1000 samples)
    cv='prefit'
)
calibrated_model.fit(X_val, y_val)

calibrated_brier = brier_score_loss(y_test, calibrated_model.predict_proba(X_test)[:, 1])
print(f"Brier score improved from {raw_brier:.4f} to {calibrated_brier:.4f}")
6. 完全なPython実装: 最適な閾値調整
ここでは、不均衡なデータで分類器を訓練し、ビジネスコストに基づいて最適な決定閾値を見つける方法を示します(Cost(FN) = $100、Cost(FP) = $5)。
import numpy as np
from sklearn.datasets import make_classification
from sklearn.model_selection import train_test_split
from sklearn.ensemble import HistGradientBoostingClassifier
from sklearn.metrics import precision_recall_curve

# Generate synthetic imbalanced dataset (1% positive class)
X, y = make_classification(
    n_samples=50_000, n_features=20, weights=[0.99, 0.01], random_state=42
)
X_train, X_test, y_train, y_test = train_test_split(X, y, test_size=0.3, stratify=y)

# Fit model
clf = HistGradientBoostingClassifier(class_weight='balanced', random_state=42)
clf.fit(X_train, y_train)

# Predict continuous probabilities
y_probs = clf.predict_proba(X_test)[:, 1]

# Calculate Precision-Recall curve
precisions, recalls, thresholds = precision_recall_curve(y_test, y_probs)

# Define Business Cost Function
COST_FALSE_NEGATIVE = 100.0  # Missed fraud cost
COST_FALSE_POSITIVE = 5.0    # User friction cost

total_costs = []
for t in thresholds:
    y_pred = (y_probs >= t).astype(int)
    fn = np.sum((y_test == 1) & (y_pred == 0))
    fp = np.sum((y_test == 0) & (y_pred == 1))
    cost = (fn * COST_FALSE_NEGATIVE) + (fp * COST_FALSE_POSITIVE)
    total_costs.append(cost)

# Find optimal threshold minimizing business loss
best_idx = np.argmin(total_costs)
optimal_threshold = thresholds[best_idx]

print(f"Default 0.5 Threshold Cost:  ${total_costs[np.abs(thresholds - 0.5).argmin()]:,.2f}")
print(f"Optimized Threshold ({optimal_threshold:.3f}) Cost: ${total_costs[best_idx]:,.2f}")
評価チートシートのまとめ
| シナリオ | 主要指標 | 副次指標 |
|---|---|---|
| バランスの取れた二値分類 | ROC-AUC | 精度 / F_1 |
| 詐欺 / 異常検出 (陽性クラス < 2%) | PR-AUC (平均Precision) | F_2スコア & コスト曲線 |
| 検索 & コンテンツ取得 | Precision@K / 平均Precision (MAP) | NDCG@K |
| 確率に敏感なシステム (入札 / リスク) | Brierスコア & 期待キャリブレーション誤差 (ECE) | Log-Loss |
こちらもおすすめ
Free In-Browser Developer Tools
Clean AI CLI logs, build cron expressions, decode JWTs, and calculate chmod permissions offline.
Related Articles

本番RAG向けVectorDatabase (2026): Pinecone vs Qdrant vs Milvus vs pgvector
本番RAGパイプライン向けにPinecone、Qdrant、Milvus、pgvectorのアーキテクチャを、HNSW vs IVFFlatインデックス、単段フィルタリング検索、p95レイテンシ、メモリフットプリントでベンチマークします。
Read more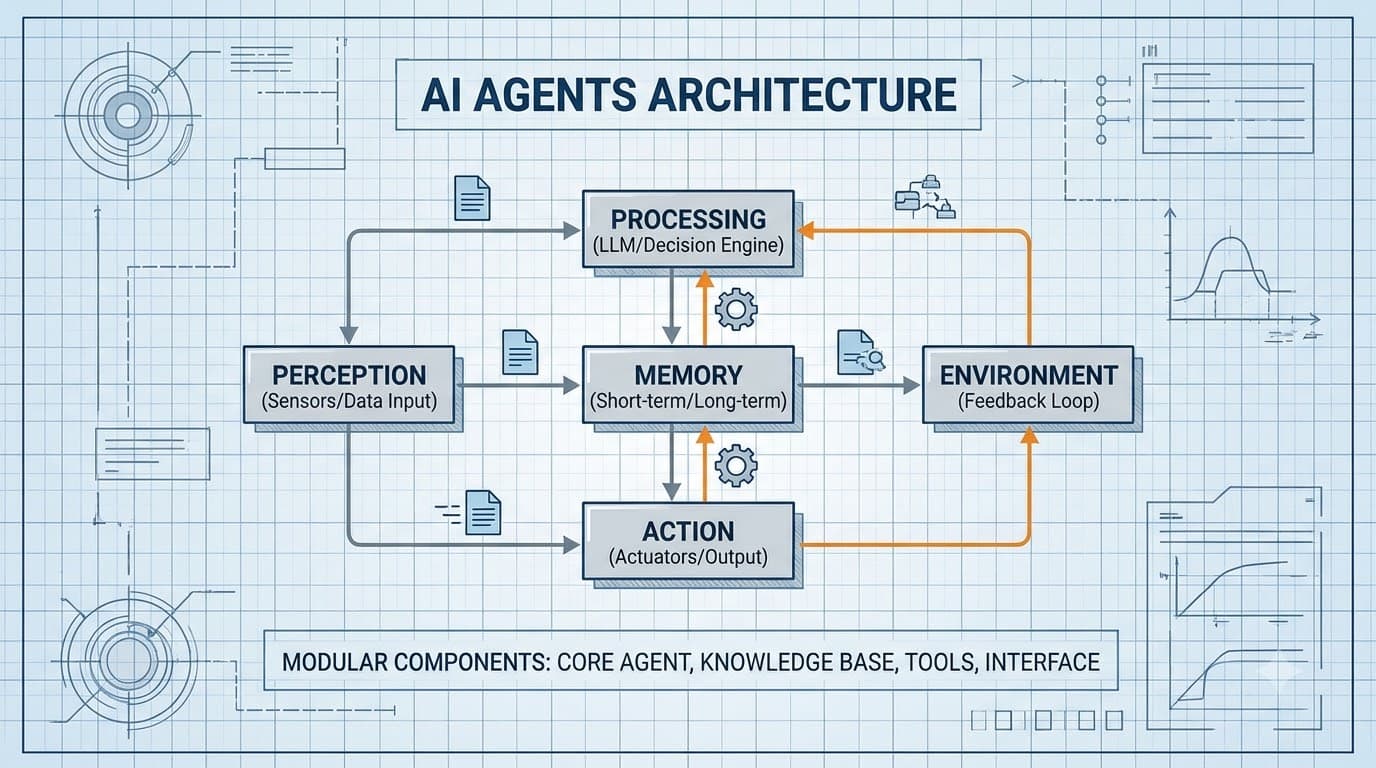
AIエージェントアーキテクチャの実践:メモリ、ツール利用、および失敗モード
ReActループ、ベクトルメモリ、ツール呼び出しパターン、マルチエージェント連携、および適切に失敗するエージェントのテスト方法など、2026年にAIエージェントシステムを構築するための実用的なガイド。
Read more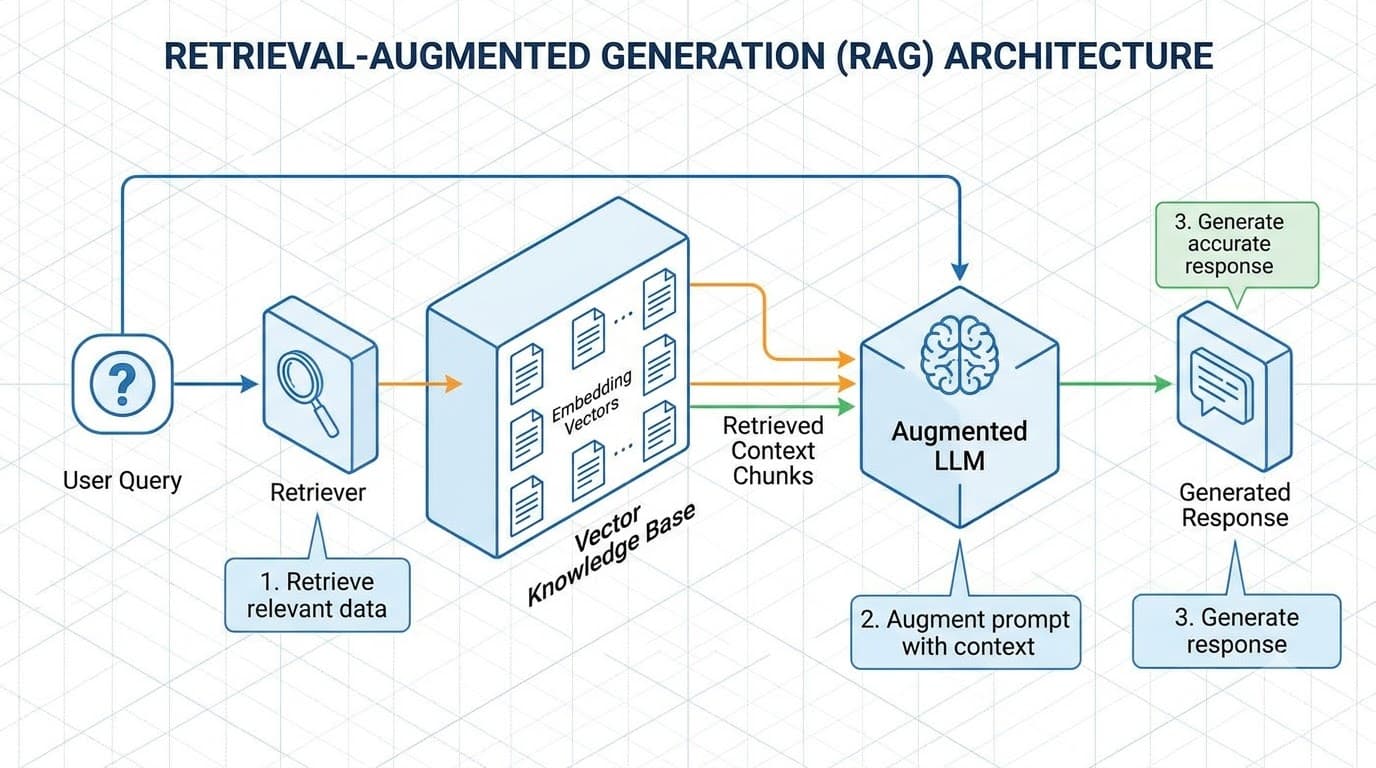
Retrieval-Augmented Generation (RAG)を理解する
Retrieval-Augmented Generation (RAG)のチャンキング戦略、ベクトル埋め込み、ハイブリッド密疎検索、リランキングパイプラインについて深く掘り下げます。
Read more