Next.js 14: Debugging the Server-Client Boundary


Next.js 14, with its App Router and React Server Components (RSC), offers a powerful mental model for building web applications. However, this new model also introduces a clear boundary between the server and the client, which can sometimes be tricky to navigate and debug.
Understanding the Boundary
In traditional React applications, almost everything was a client component (even if it was initially server-side rendered). The code you wrote was expected to run in the browser, making debugging straightforward using standard browser dev tools.
With React Server Components, the paradigm shifts. Components by default are Server Components—they run only on the server, fetch data directly, and pass HTML and a serialized representation of themselves to the client. Client Components (marked with 'use client') are used for interactivity and run on both the server (for SSR) and the client (for hydration).
The "boundary" is the point where a Server Component passes data or renders a Client Component. Navigating this boundary is where most developers encounter issues, particularly around data serialization, hydration, and component nesting rules.
Common Debugging Scenarios
1. Serialization Errors
When passing props from a Server Component to a Client Component, the data must be serializable by React. This means you can pass strings, numbers, booleans, arrays, and plain objects. You cannot pass functions, Dates, Maps, Sets, or classes directly.
If you attempt to pass a non-serializable prop, Next.js will throw an error. Debugging this requires checking the exact shape of the data you're passing. Often, this happens when passing the result of a database query or a complex API response directly to a Client Component. The solution is usually to map over the data and extract only the necessary, serializable fields before passing it down.
2. Hydration Mismatches
Hydration mismatches occur when the HTML generated on the server differs from what the client expects to render during hydration. This is often caused by using browser-only APIs (like window or localStorage) during the initial render phase of a Client Component.
Debugging hydration errors can be challenging because the stack trace might not immediately point to the offending component. A common strategy is to systematically comment out parts of your component tree until the error disappears, thereby isolating the problematic code.
If you're struggling with hydration issues, I strongly recommend reading this detailed guide on troubleshooting Next.js hydration errors.
3. "use client" Placement
A frequent source of confusion is where to place the 'use client' directive. A common mistake is putting it too high up in the component tree, effectively turning the entire application into Client Components and losing the benefits of RSC.
Conversely, forgetting to add 'use client' to a component that uses hooks like useState or useEffect will result in a runtime error, as these hooks are not available in Server Components.
The best practice is to push the 'use client' boundary as far down the tree as possible. Keep your data fetching and layout logic in Server Components, and only use Client Components for the specific interactive elements (like buttons, forms, or complex UI widgets).
Debugging Tools and Techniques
Next.js provides several tools and techniques to help you debug issues at the server-client boundary.
Next.js Error Overlay
In development mode, Next.js provides a robust error overlay that clearly distinguishes between server-side and client-side errors. Pay close attention to whether the error occurred during compilation, server rendering, or client hydration, as this context is crucial for diagnosing the issue.
React DevTools
The React DevTools browser extension has been updated to support Server Components. It allows you to inspect the component tree and see which components are Server Components and which are Client Components. This visualization is invaluable for understanding the structure of your application and verifying that the boundary is where you expect it to be.
Console Logging
While it sounds basic, console.log remains a powerful debugging tool. However, you must be aware of where the log will appear.
- Logs in Server Components will appear in your terminal where the Next.js development server is running.
- Logs in Client Components will appear in the browser's console.
This distinction can sometimes cause confusion if you're expecting a log to appear in the browser but the code is actually running on the server.
Isolating Data Fetching
When debugging complex pages, a good technique is to isolate the data fetching logic from the rendering logic. Try logging the raw data returned by your API or database before passing it to any components. This helps determine whether the issue lies with the data itself or how the components are consuming it.
Mastering the server-client boundary is essential for building efficient and maintainable applications with Next.js 14. By understanding the rules of serialization, strategically placing the 'use client' directive, and utilizing the available debugging tools, you can confidently navigate this new architecture and build exceptional user experiences.
You Might Also Like
Free In-Browser Developer Tools
Clean AI CLI logs, build cron expressions, decode JWTs, and calculate chmod permissions offline.
Related Articles
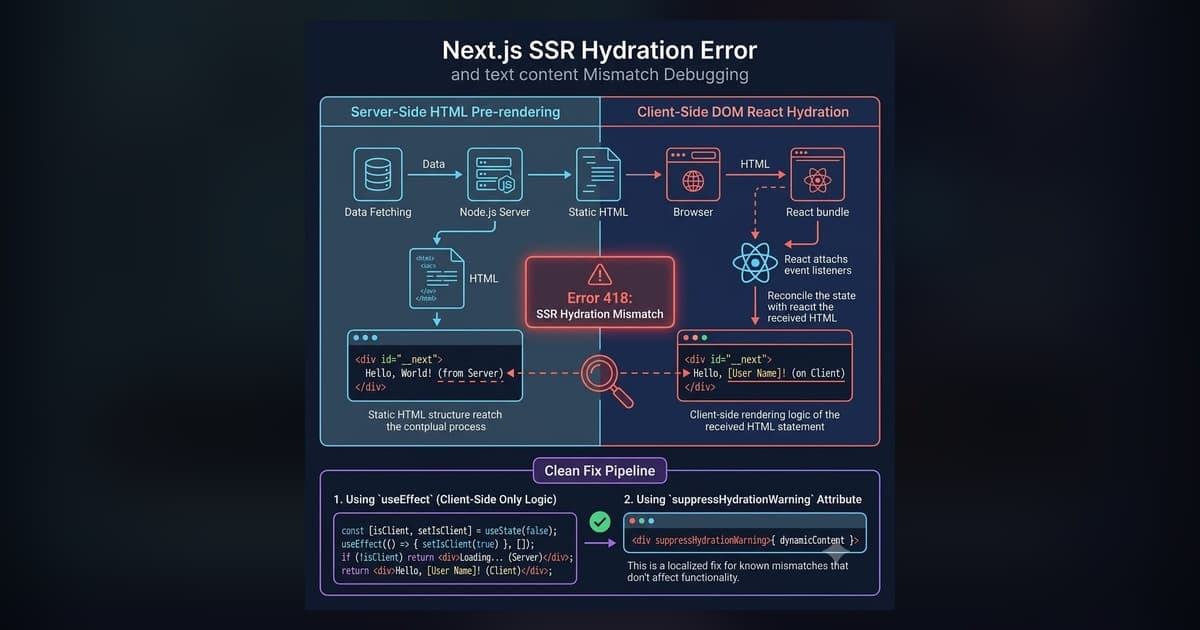
Next.js Hydration Errors: Fix 418, 423 & Text Mismatch
Complete guide to fixing Next.js hydration errors: Resolve React Error #418, Error #423, Text Content Mismatch, and window/localStorage SSR bugs with interactive diagnostics and copy-paste code.
Read more
Mastering Next.js 14+ Metadata & Open Graph: Dynamic Social Cards at Scale
Turn social media shares into massive organic traffic drivers. Master Next.js generateMetadata, Open Graph tags, Twitter Cards, and dynamic Edge OG image generation.
Read more
Next.js Server Actions
Master Next.js Server Actions for full-stack data mutations: explore compilation mechanics, form actions, revalidatePath caching, and security boundaries.
Read more