Profiling Async Python Memory Leaks in Production
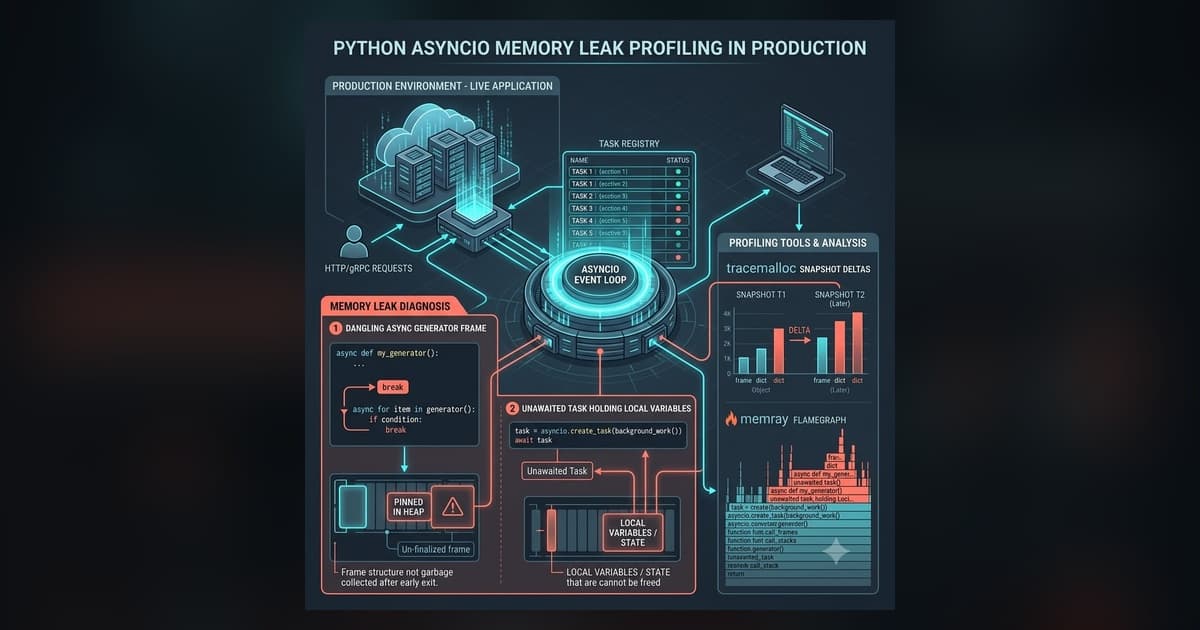

Table of Contents
- Root causes: Why asyncio retains uncollected objects
- Pinpointing dangling generator frames with tracemalloc
- Profiling native C extensions and heap bloat with Memray
- Patterns for leak-free async generators and background tasks
- You Might Also Like
- Technical Reference and Troubleshooting
- Process RSS Retention After Task Completion
- Pinned Traceback Frames from Unhandled Exceptions
- Weakref Patterns for Async Caches
- Unbounded Queue Retention in Worker Pools
- Explicit Garbage Collection vs pymalloc Recycling
- Process RSS vs Heap Memory Allocation
If you have ever run a high-concurrency async Python service in production, you have probably watched your memory charts slowly climb until your orchestrator finally kills the pod with an OOM killer (exit code 137).
While Python's garbage collector cleans up standard reference cycles, the asyncio event loop introduces subtle ways to hold onto memory. Unawaited tasks, background futures missing callbacks, and unclosed async iterators silently pin objects inside the event loop's internal state.
Quick diagnostic reference:
| Symptom | Root Cause | Diagnosis Tool | Fix |
|---|---|---|---|
| RSS climbs after early loop exit | Dangling async def generator frame | tracemalloc.take_snapshot() | contextlib.aclosing() or explicit await gen.aclose() |
| Pod killed with OOM under load | Unawaited tasks in asyncio.all_tasks() | asyncio.all_tasks(loop) dump | asyncio.TaskGroup or strong ref set discard |
| Memory stays high after tasks finish | CPython pymalloc fragmentation | memray run --live | Set MALLOC_TRIM_THRESHOLD_ or worker recycling |
| Unhandled exception consumes RAM | Traceback frames pinned in task object | sys.unraisablehook logging | Explicit exception retrieval or task callback |
Production Concurrency & Profiling Handbook
Looking for a complete architectural guide to production concurrency, asyncio task groups, threading vs multiprocessing, and memory profiling? Read our comprehensive High-Performance Concurrency and Profiling Chapter in the Modern Python Series.
Root causes: Why asyncio retains uncollected objects
Python asyncio loops accumulate leaked objects primarily when unawaited tasks, circular references in async generators, or unclosed event loop callbacks hold strong references in heap memory.
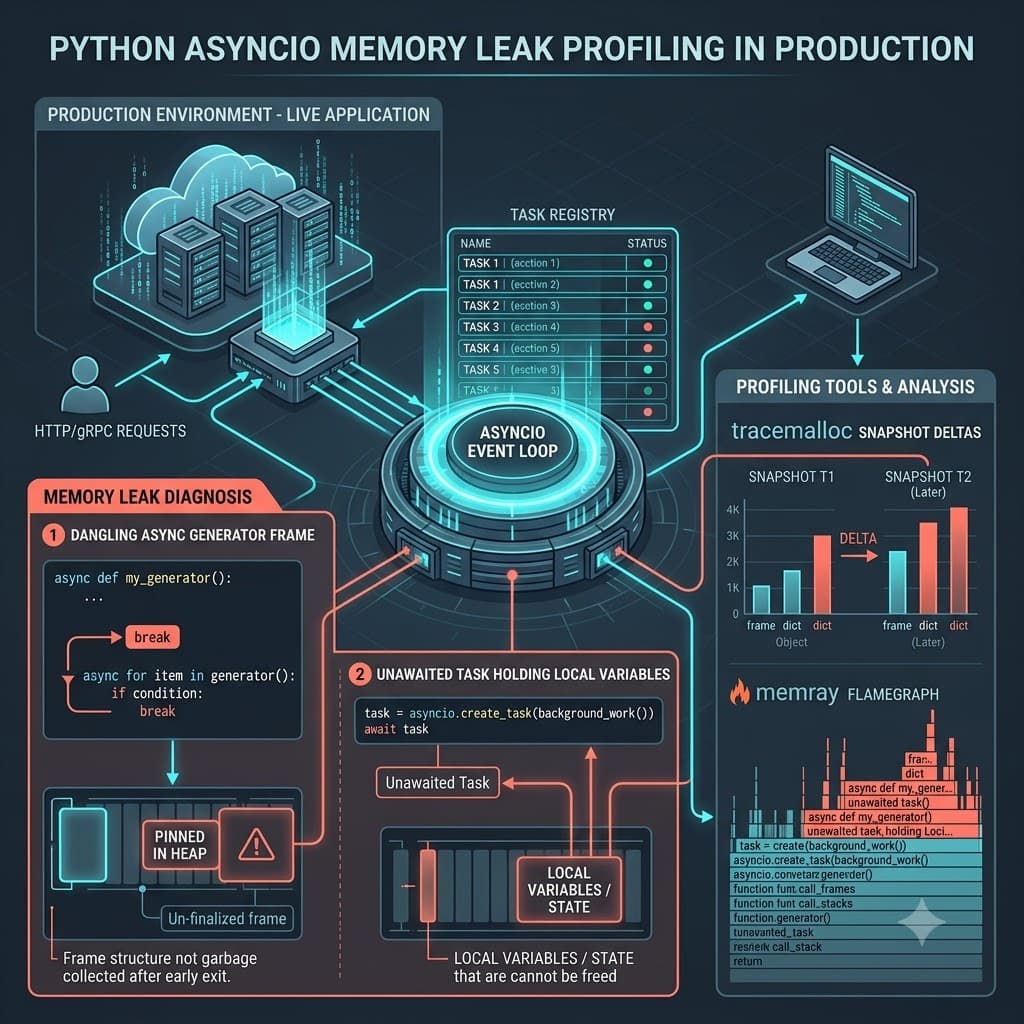
When an asynchronous task starts executing inside an active event loop, the scheduler registers strong references to the underlying task object inside its internal running set. If a background worker spawns coroutines without properly gathering or awaiting their results, those tasks remain registered in memory even after processing completes. The event loop can't garbage collect completed task frames when custom exception handlers or unretrieved results hold references to local frame variables. Additionally, asynchronous generators created with async def maintain internal generator frame references until explicitly closed or exhausted by the calling loop. When developers don't close these generators properly during early loop exits, CPython keeps the entire execution frame pinned in RAM indefinitely.
Consider a high-throughput API gateway that processes streaming payload chunks through an asynchronous generator loop:
import asyncio
import gc
from typing import AsyncGenerator

class PayloadBuffer:
    def __init__(self, data_chunk: bytes) -> None:
        self.data_chunk = data_chunk
        self.processed = False
        self.metadata: dict[str, str] = {"origin": "gateway_ingress", "status": "buffered"}

async def stream_payload_chunks(raw_stream: list[bytes]) -> AsyncGenerator[PayloadBuffer, None]:
    for chunk in raw_stream:
        buffer = PayloadBuffer(chunk)
        # Danger: If consumer breaks early, this generator frame stays uncollected in memory
        yield buffer
        buffer.processed = True

async def leaky_request_handler(payload_chunks: list[bytes]) -> None:
    gen = stream_payload_chunks(payload_chunks)
    async for item in gen:
        if item.data_chunk.startswith(b"ABORT"):
            # Early break leaves the generator frame dangling in memory without finalization
            print("Aborting stream processing immediately due to invalid chunk payload header")
            break
In the snippet above, breaking out of the async for loop leaves the generator instance suspended mid-execution. Because the generator frame holds references to PayloadBuffer objects and local stream variables, garbage collection cycles fail to reclaim that memory until the loop terminates. When thousands of requests break early due to validation failures or client disconnects, accumulated generator frames consume hundreds of megabytes of process RSS memory. If your service handles tens of thousands of requests per hour, this memory leak pattern will consume available system memory rapidly.
To prevent this specific retention vector, production services must ensure that all asynchronous generators implement explicit finalization using aclose or context managers. Additionally, developers shouldn't leave background tasks untracked without attaching task completion callbacks that clean up references upon execution termination. When building resilient server architectures, understanding these reference lifetime rules isn't optional for backend engineers.
Understanding the internal representation of asyncio tasks helps clarify why unawaited futures persist across event loop ticks. Every task instance contains an explicit reference dictionary containing traceback frames, local variables, contextvars structures, and exception details. When an uncaught exception occurs within a background task that nobody awaits, CPython retains the traceback object to print it when the task gets garbage collected. However, if the task itself remains referenced inside a global registry or an active event loop callback table, that garbage collection pass never occurs. Consequently, large payload structures referenced inside the task frame remain trapped in memory indefinitely.
Another frequent source of memory retention involves improper usage of asyncio.Queue objects in worker pool architectures. When queue producers push items faster than consumer tasks can process them, unmanaged queues swell to huge sizes. Even when consumers eventually catch up, Python's internal memory allocator doesn't immediately release freed memory back to the operating system host. Understanding the boundary between Python's internal pymalloc heap allocator and system-level memory managers is essential when interpreting production memory charts.
Pinpointing dangling generator frames with tracemalloc
Tracemalloc identifies uncollected async generator frames by taking trace snapshots of heap allocations and comparing memory differences between garbage collection cycles.

The standard Python tracemalloc module captures tracebacks for every object allocated on the Python heap when initialized early in application execution. By taking baseline snapshots after application warm-up and comparing them against snapshots taken after executing stress workloads, developers can pinpoint exact source code line numbers responsible for accumulating memory blocks. For asynchronous applications, filtering snapshots by specific module filenames isolates leak candidates from standard event loop overhead. By analyzing line-by-line memory allocation deltas, engineers can distinguish temporary memory spikes from persistent memory leaks.
Here is a complete production profiling utility that tracks allocation growth across asynchronous execution cycles:
import asyncio
import tracemalloc
import linecache
import gc
from typing import Any

class AsyncMemoryProfiler:
    def __init__(self, top_n: int = 10) -> None:
        self.top_n = top_n
        self.snapshot_before: tracemalloc.Snapshot | None = None

    def start(self) -> None:
        tracemalloc.start(25)
        self.snapshot_before = tracemalloc.take_snapshot()

    def compare_with_baseline(self) -> list[str]:
        if self.snapshot_before is None:
            raise RuntimeError("Profiler wasn't started prior to baseline comparison execution")

        # Force a garbage collection pass before taking the current snapshot
        gc.collect()
        snapshot_after = tracemalloc.take_snapshot()
        stats = snapshot_after.compare_to(self.snapshot_before, "lineno")

        report_lines: list[str] = []
        for stat in stats[:self.top_n]:
            frame = stat.traceback[0]
            filename = frame.filename
            line_number = frame.lineno
            line_text = linecache.getline(filename, line_number).strip()
            size_kb = stat.size_diff / 1024
            count_diff = stat.count_diff
            report_lines.append(
                f"File: {filename}:{line_number} | Diff: {size_kb:+.2f} KB | Objects: {count_diff:+} | Code: {line_text}"
            )
        return report_lines
Executing this profiler during load test iterations exposes allocation sources that grow monotonically under traffic:
async def run_profiling_suite() -> None:
    profiler = AsyncMemoryProfiler(top_n=5)
    profiler.start()

    # Simulate processing 5000 concurrent streaming requests inside worker loops
    for iteration in range(5000):
        fake_chunks = [b"HEADER_START", b"DATA_CHUNK_001", b"ABORT_SIGNAL_TRIGGER"]
        await leaky_request_handler(fake_chunks)

    results = profiler.compare_with_baseline()
    print("
--- Memory Allocation Delta Report Summary ---")
    for entry in results:
        print(entry)
Analyzing tracemalloc reports reveals exact allocation points where generator objects, dictionary frames, and string allocations persist between requests. When tracemalloc shows steady increases in allocation count for generator instantiation lines, developers can immediately confirm unclosed generator leaks without attaching heavy external debuggers. Incorporating automated tracemalloc assertions inside your continuous integration suite prevents memory leak regressions from reaching staging environments.
However, tracemalloc only records allocations made through Python's standard memory allocators (PyMem_Malloc and PyObject_Malloc). If your application utilizes C extensions or native compiled libraries that bypass Python allocators, tracemalloc will miss those allocations entirely. Building a complete profiling workflow requires pairing tracemalloc with native system allocators when working with high-performance native extensions.
When inspecting tracemalloc output, pay attention to traceback depth configurations. By default, tracemalloc records only one stack frame per allocation to minimize performance overhead. Increasing frame depth to twenty-five frames allows engineers to trace object instantiation back to high-level application handlers across asynchronous yield points. While deeper traceback capture increases profiling memory usage slightly, it provides critical contextual visibility when debugging complex asynchronous call chains.
In complex event-driven microservices, filtering snapshot differences by domain-specific file patterns helps isolate application bugs from third-party framework allocations. By ignoring standard library frames and web framework internal loops, engineers focus directly on custom business logic where leaks originate. Combining domain filters with statistical aggregation grouped by line number yields clear, actionable debugging summaries.
Profiling native C extensions and heap bloat with Memray
Memray tracks native C-extension async memory bloat by profiling C-level memory allocations alongside Python stack frames to highlight unmanaged C-buffers.

Native libraries such as numpy, pyarrow, grpc, or custom C-extensions allocate memory directly through system malloc or custom C++ allocators. When asynchronous workers pass data buffers into C extensions without explicitly freeing underlying pointers, process memory increases rapidly despite tracemalloc reporting stable Python heap usage. Memray hooks into both Python interpreter internals and low-level memory allocation symbols to build unified flamegraphs of memory distribution across C and Python boundaries. This capability makes Memray invaluable when debugging asynchronous database drivers or machine learning inference servers.
To profile an asynchronous server process with Memray in production or staging environments, launch the application using the Memray CLI wrapper:
# Run the asynchronous service under Memray profiling wrapper with live monitoring
memray run --live --output async_profile.bin -m uvicorn app.main:app --port 8000 --workers 1
While live profiling mode provides immediate console feedback, generating interactive HTML reports allows detailed inspection of call stacks across time intervals:
# Generate interactive flamegraph visualization from binary capture dataset
memray flamegraph async_profile.bin -o memray_flamegraph.html

# Generate table report filtered by allocation size thresholds
memray table async_profile.bin -o memray_table.html
When reviewing Memray output for asynchronous applications, pay close attention to allocations performed inside worker threads or C-extension callbacks. The following table summarizes key operational differences between tracemalloc and Memray for asynchronous debugging workflows:
| Feature Dimension | Python Tracemalloc | Memray C Profiler |
|---|---|---|
| Profiling Overhead | Low (5% to 15% execution slowdown) | Moderate (15% to 35% execution slowdown) |
| C Extension Tracking | Unsupported (Python heap allocations only) | Fully Supported (Tracks native malloc and calloc) |
| Output Visualizations | Console text summaries and stats lists | Interactive HTML flamegraphs and 3D maps |
| Production Suitability | Highly safe for live staging environments | Best suited for load testing and staging passes |
| Stack Frame Depth | Configurable line number trace depth | Complete unified C and Python call stack depth |
Using Memray alongside tracemalloc gives teams total visibility over both high-level Python object retention and low-level C-buffer leaks in asynchronous pipelines. When teams combine both tools, they create a comprehensive diagnostic framework capable of identifying any memory retention anomaly across the entire software stack.
Memray's native allocation tracking reveals subtle bugs in high-performance C libraries that standard Python tools miss entirely. For instance, when using pyarrow to process streaming IPC records inside an asynchronous endpoint, unclosed record batch readers allocate native C++ memory buffers that never register inside sys.getsizeof() calls. Memray highlights these native memory blocks directly on its flamegraph, pointing developers directly to the missing C++ destructor call or unreleased Arrow table handle.
Additionally, Memray includes specialized tracking modes for multi-threaded and multi-process asynchronous applications. When running web servers like Uvicorn or Gunicorn with multiple worker processes, Memray can capture allocations across all worker instances simultaneously. Analyzing aggregated worker reports prevents situations where memory leaks appear only under specific load balancing configurations or multi-process race conditions.
Patterns for leak-free async generators and background tasks
You should structure leak-free async generators by wrapping resource initialization inside try-finally blocks and explicitly finalizing unclosed iterators using aclose calls.

The safest mechanism for managing asynchronous generator lifecycles involves using contextlib.aclosing or building custom asynchronous context managers. The aclosing helper guarantees that even if a consumer breaks early from an async for loop, the generator's aclose() method will be called immediately upon context exit. This triggers the execution of any finally blocks inside the generator frame, releasing held references and closing network sockets properly. Implementing this pattern across all streaming endpoints ensures that unexpected client disconnects don't leave lingering generator objects in memory.
Here is the refactored, leak-free version of our earlier streaming payload processor:
import asyncio
from contextlib import aclosing
from typing import AsyncIterator

async def resilient_stream_processor(raw_chunks: list[bytes]) -> AsyncIterator[bytes]:
    # Resilient async generator with explicit cleanup guarantee inside try finally block
    try:
        for chunk in raw_chunks:
            # Yielding control to caller while maintaining cleanup safety guarantees
            yield chunk
    finally:
        # This block executes reliably when generator.aclose() gets called by caller
        print("Cleaning up stream processing generator frame resources cleanly")

async def safe_request_handler(payload_chunks: list[bytes]) -> None:
    # Wrapping async iterator inside aclosing context manager wrapper
    async with aclosing(resilient_stream_processor(payload_chunks)) as stream:

        async for chunk in stream:
            if chunk.startswith(b"ABORT"):
                print("Safely exiting stream processing via context manager finalization")
                break
In addition to using aclosing, services running background asyncio tasks should track active futures using a task management registry. When background tasks finish, the registry removes task references using completion callbacks:
class TaskRegistry:
    def __init__(self) -> None:
        self._active_tasks: set[asyncio.Task[Any]] = set()

    def spawn_tracked_task(self, coroutine: Any) -> asyncio.Task[Any]:
        task = asyncio.create_task(coroutine)
        self._active_tasks.add(task)
        # Discard task reference automatically upon completion callback trigger
        task.add_done_callback(self._active_tasks.discard)
        return task

    async def shutdown(self) -> None:
        if self._active_tasks:
            print(f"Cancelling pending background tasks count: {len(self._active_tasks)}")
            for task in self._active_tasks:
                task.cancel()
            await asyncio.gather(*self._active_tasks, return_exceptions=True)
Adopting structured task management and context-managed asynchronous generators eliminates the vast majority of memory retention bugs in production asyncio microservices. Software engineers who establish these architectural patterns across their engineering teams consistently maintain low process RSS footprints even under severe traffic spikes.
When choosing an ASGI framework for these services, framework architecture heavily influences baseline memory per worker. See our FastAPI vs Litestar benchmark comparison for per-worker memory footprints and throughput. When deploying to container environments, build your runtime with Astral uv in multi-stage Docker builds to keep base images lean.
To ensure long-term stability in high-volume microservices, software teams must integrate automated memory profiling into their continuous integration pipelines. Running load tests against staging environments with tracemalloc enabled allows developers to catch allocation regressions before code reaches production servers. In addition, setting strict RSS memory limits inside container orchestration platforms like Kubernetes ensures that any unexpected memory accumulation triggers controlled pod restarts rather than cascading node failures across microservice clusters.
Establishing clear operational runbooks for memory troubleshooting ensures that engineering teams respond effectively when memory alerts fire. When an alert indicates rising memory usage in a production container, engineers should immediately capture a heap snapshot using an embedded diagnostic endpoint before restarting the service instance. Inspecting heap snapshots taken directly from live production nodes provides unassailable evidence regarding which data structures caused the memory expansion.
Finally, design your asynchronous data pipelines to enforce upper limits on internal queue depths and concurrency semaphores. Unbounded queues and unthrottled worker tasks remain the primary operational cause of unexpected memory expansion under load spikes. By pairing bounded queues with explicit task registries and context-managed asynchronous generators, you construct resilient Python applications capable of running indefinitely without memory degradation.
You Might Also Like
- Optimizing Python FastAPI for High-Concurrency
- FastAPI vs Litestar (2026): Performance, Benchmarks & When to Switch
- FastAPI vs Celery: When to Use BackgroundTasks vs Distributed Task Queues
- A Practical List of Annoying Click Tasks—and How to Automate Them with Python
Technical Reference and Troubleshooting
Process RSS Retention After Task Completion
Python uses custom internal memory pools managed by pymalloc to handle small object allocations efficiently. When objects are garbage collected inside asyncio loops, pymalloc frees memory back to internal Python pools rather than returning pages to the operating system kernel. Consequently, system tools like top or ps report high RSS memory usage even though Python's internal heap has reclaimed the space for future allocations.
Pinned Traceback Frames from Unhandled Exceptions
When a background task raises an unhandled exception and stays unawaited, the exception object stores a reference to its execution traceback frame. This traceback frame retains references to all local variables, arguments, and intermediate objects present when the error occurred. Unless another component awaits the task or extracts the exception, those objects remain pinned in memory indefinitely.
Weakref Patterns for Async Caches
Using weakref.WeakValueDictionary or weakref.WeakKeyDictionary prevents in-memory cache implementations from pinning objects indefinitely. When cached objects no longer have strong references elsewhere in the application, garbage collection automatically removes them from weak reference dictionaries, avoiding manual cache eviction bugs.
Unbounded Queue Retention in Worker Pools
Unclosed asyncio queues hold strong references to all item payloads buffered inside their internal deque structures. If worker tasks crash or exit without draining the queue, remaining item payloads and associated context variables persist in memory until the queue object itself is garbage collected.
Explicit Garbage Collection vs pymalloc Recycling
Explicit calls to gc.collect() should generally be avoided in production hot paths because full garbage collection pauses event loop execution. However, calling gc.collect() periodically inside dedicated background maintenance loops or right after completing large batch jobs helps clean up cyclic references before heap fragmentation occurs.
Process RSS vs Heap Memory Allocation
Resident Set Size (RSS) measures total physical RAM allocated to the process by the OS kernel, including C libraries and native buffers. Heap memory measured by tools like tracemalloc tracks only Python objects managed directly by the CPython runtime allocator.
Free In-Browser Developer Tools
Clean AI CLI logs, build cron expressions, decode JWTs, and calculate chmod permissions offline.
Related Articles

Python Concurrency in 2026: AsyncIO vs Threads vs Processes
Why 4 threads can make CPU code 50% slower. Compare AsyncIO event loops, GIL workarounds, and multiprocessing benchmarks with architectural decision trees.
Read more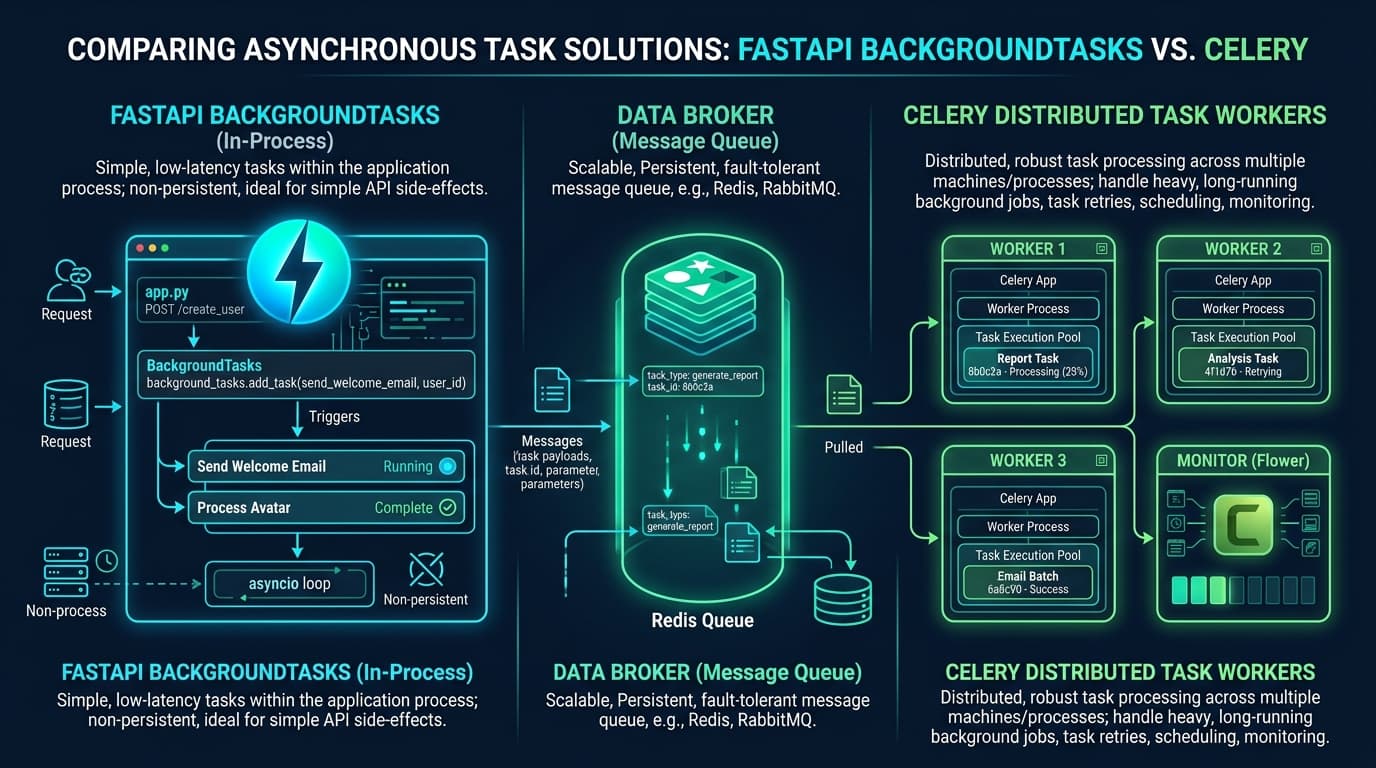
FastAPI vs Celery: When to Use BackgroundTasks vs Distributed Task Queues
FastAPI BackgroundTasks vs Celery: architectural trade-offs, event-loop blocking risks, Redis message brokers, memory benchmarks, and when to switch.
Read more
Vector Databases for Production RAG (2026): Pinecone vs Qdrant vs Milvus vs pgvector
An architectural benchmark of Pinecone, Qdrant, Milvus, and pgvector for production RAG pipelines: HNSW vs IVFFlat indexing, single-stage filtered search, p95 latency, and memory footprint.
Read more